
Close
For each user, Digital Fingerprints can provide independent models based on users’ behaviour – one runs on a keyboard, another on mouse/touchpad etc. activity. But what does it really mean?
We get some data about how the user behaves – and then we need to make a decision – whether it was the real user or not?
If you know a bit about statistics you are surely aware that there is no way to be free from some kind of error. In binary classification – like ours – we can have two types of errors:
The most interesting thing – both for us and for our clients – would be to determine which of these two are being made.
Very popular and easy-to-understand way to see what is the accuracy of our classifier is a confusion matrix. Let me show you a simplified version of it, which shows how it is done in Digital Fingerprints:
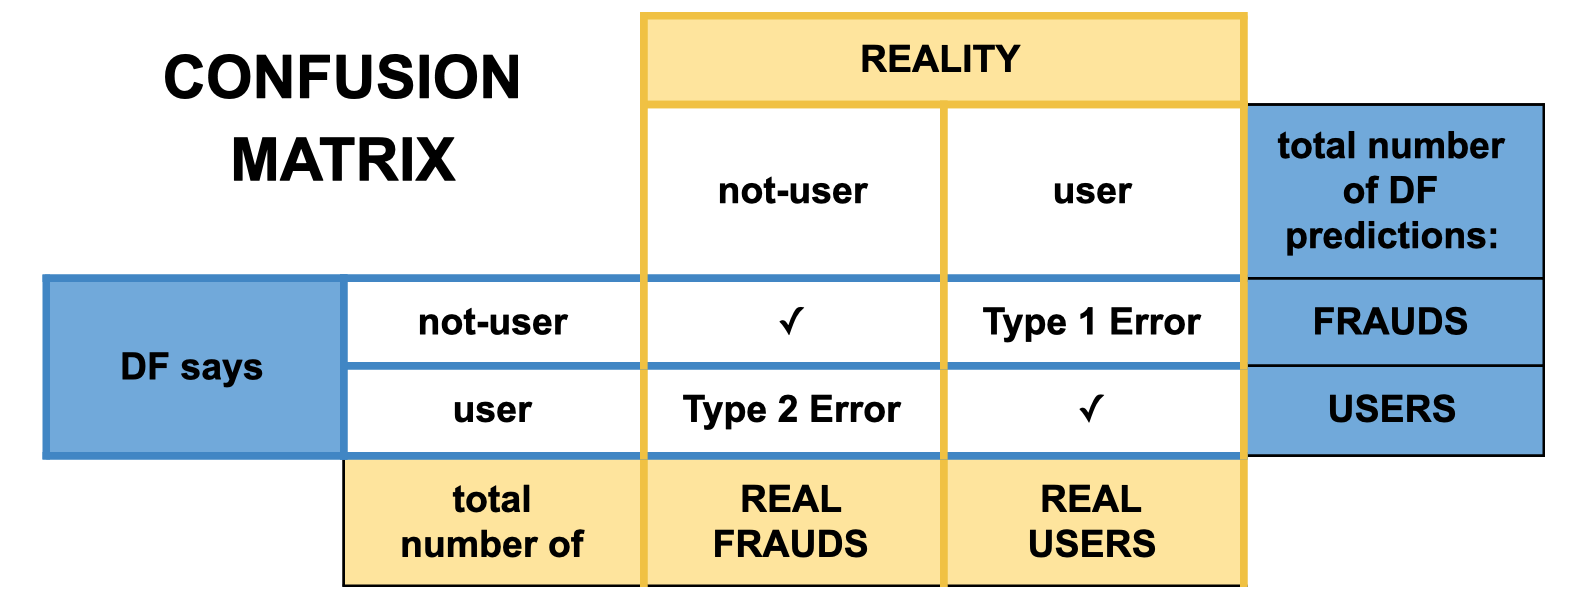
In each field, we would put a number of cases when we classified user as a user etc. And then we can count many kinds of metrics which will show us how good we are from different points of view. Let’s start from the most popular one – accuracy (ACC) – which overall answers the question: how often are we correct?
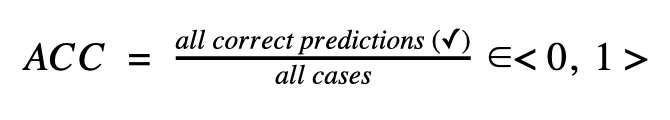
The closer to 1 accuracy is, the fewer mistakes our classifier is making.
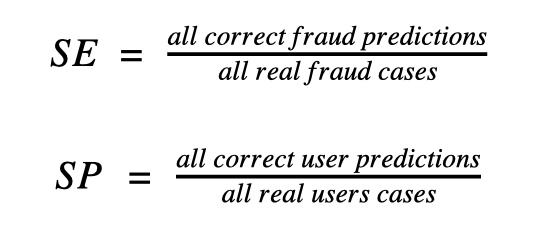
Other important metrics are sensitivity (SE) and specificity (SP).
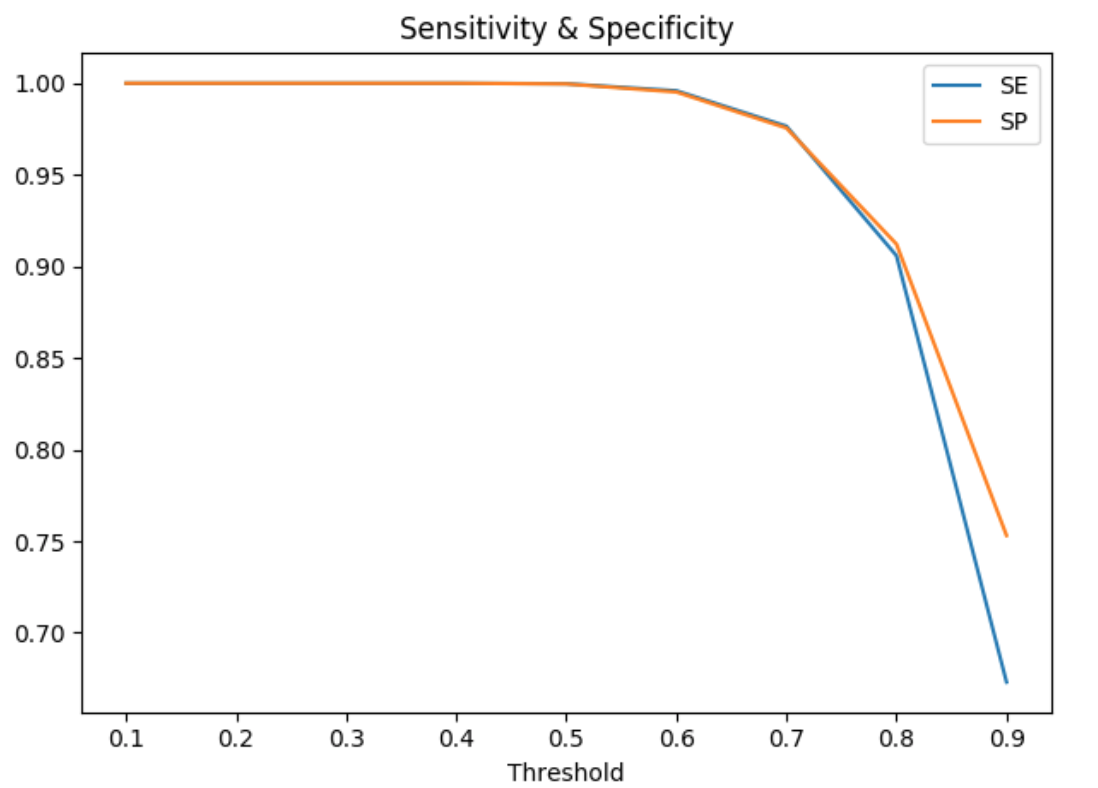
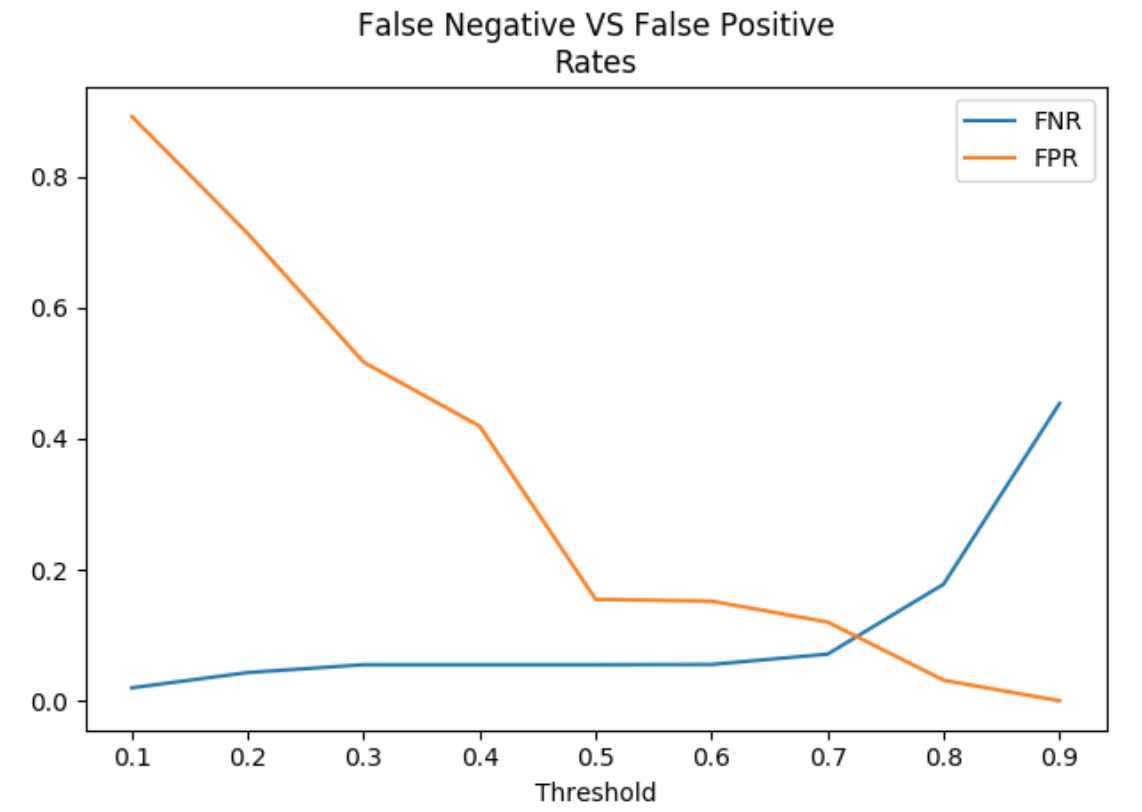
The plot displays an example of how those two metrics can depend on a threshold. As you can see – both lines go quite similar – that’s why more useful would be to see ROC curve – but first, let’s get to know two more metrics.
If we want to focus more on mistakes we can validate false negative rate (FNR) and false positive rate (FPR). Those metrics are very helpful while making a decision which threshold is best for each user.
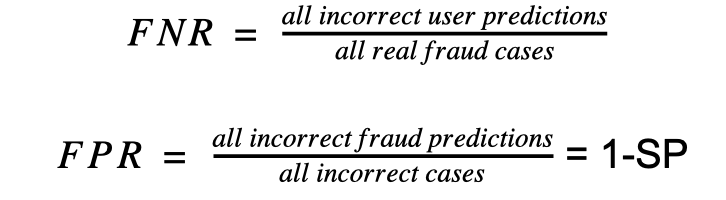
False Positive Rate is actually equal to 1 – Specificity. If we want to combine all those results into one plot – here ROC curve comes into play. Below are some examples of how it may look:
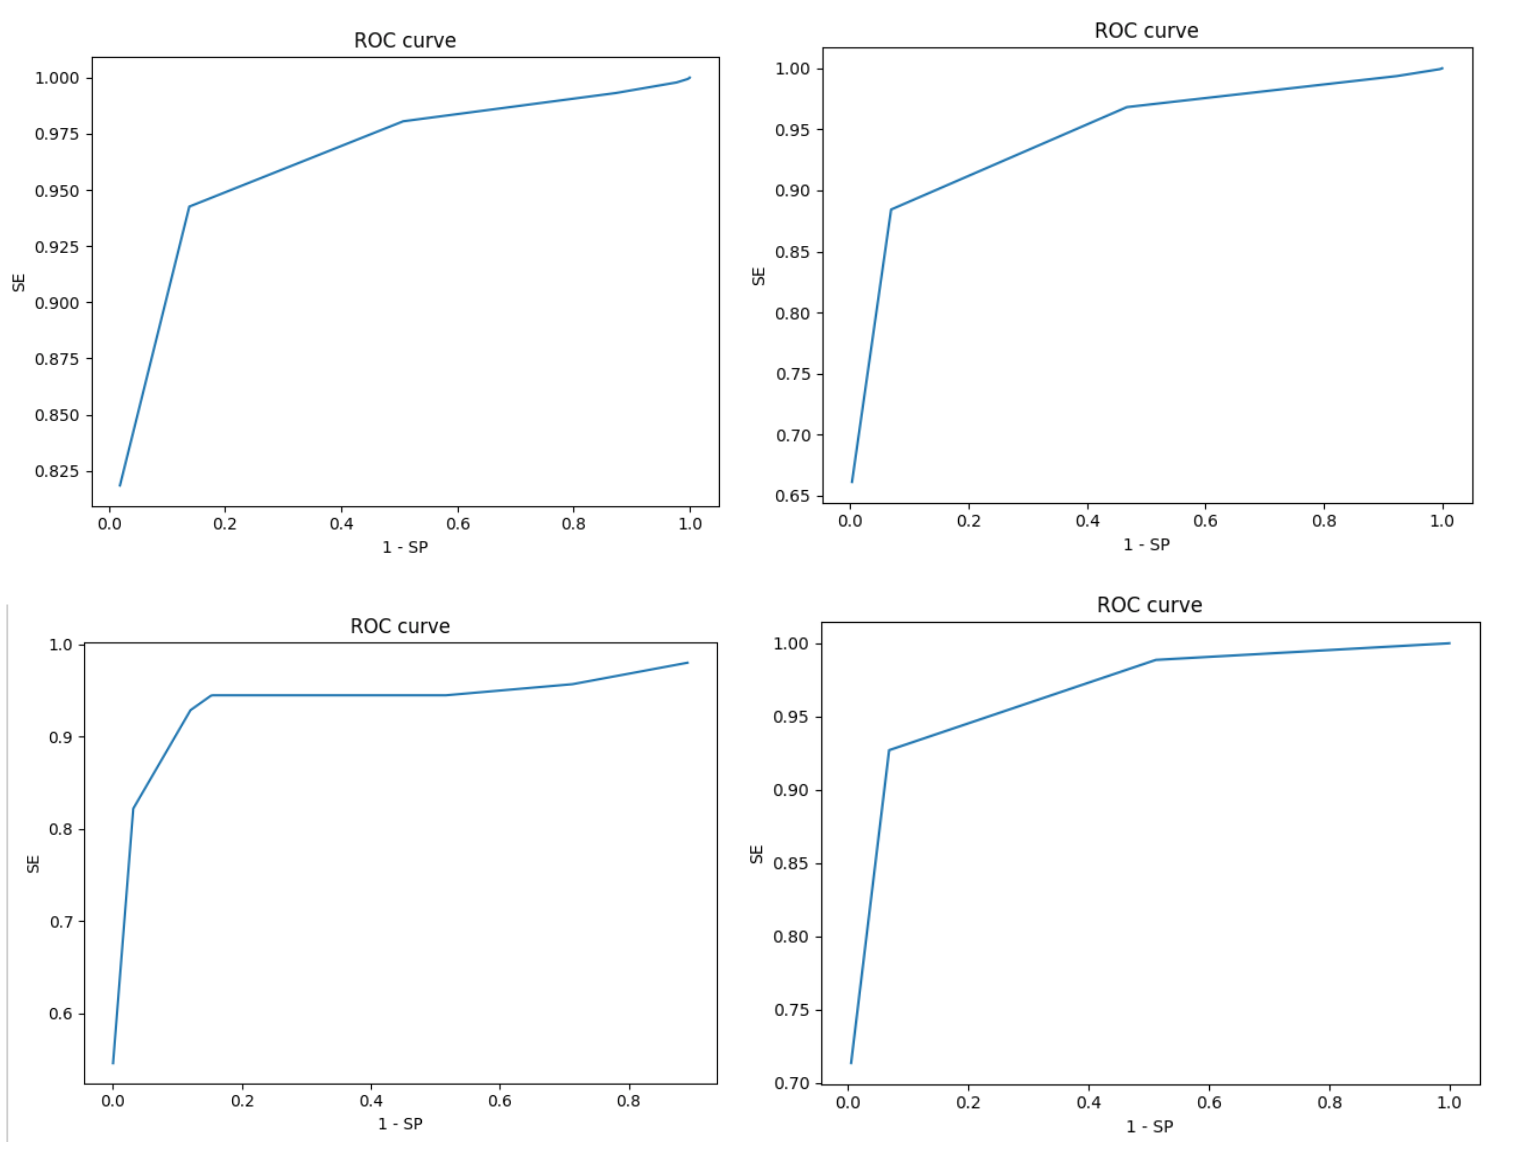
AUC – the Area Under Curve gives us the idea of how a model is performing. To make the long story short – the larger the area is, the better model we have. So this simply indicates how well the probabilities from the positive classes are separated from the negative ones.
According to those (and actually many others) metrics we can choose the best possible model accuracy which will fit your needs.
Just tell us about your expectations and we will figure out the best solution!
References